From the Dashboard you can use the sidebar to navigate to the Streaming, Settings, and Security sections, to access documentation through the Help Center, or to Sign Out of the decoder. For details, see Exploring the Web Interface. The dashboard also provides visual references to quickly asses the state of each decoder as well as the unit as a whole.
The following sections describe the Makito X4 Decoder Dashboard functionality.
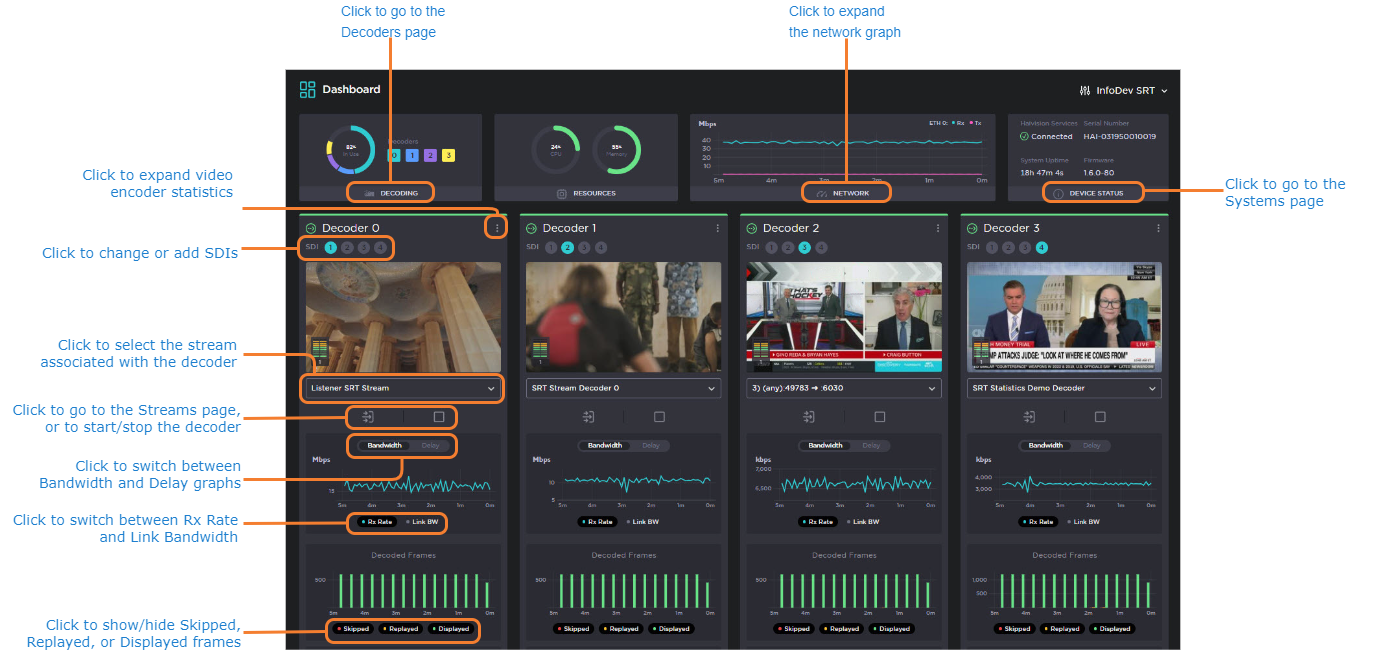
System Monitoring
The dashboard provides users with key system information, including:
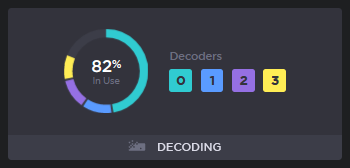
Decoding resources in use. Click Decoding here to go to the Decoders page.
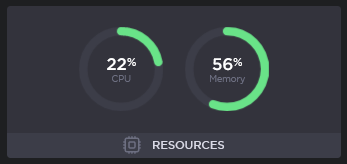
CPU and Memory resources in use.
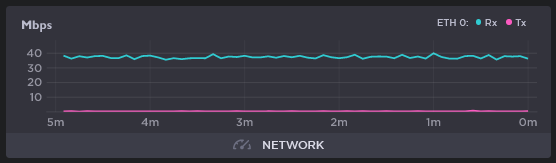
Network Receive and Transmit Rates. Click Network here to expand the graph.
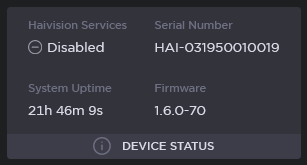
Device Status information. Click Device Status here to go to the System page.
Navigation and Configuration
From the Dashboard, users have certain navigation and configuration options.
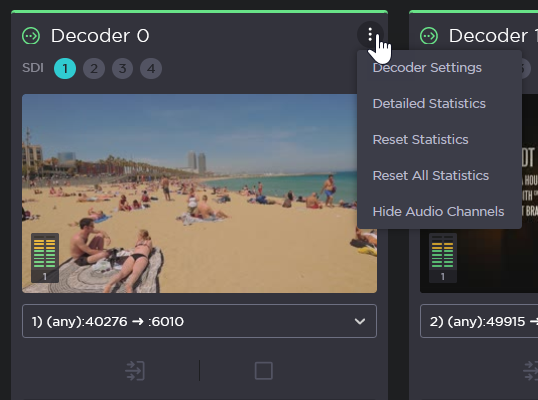
From any decoder panel, click the More Options menu. From this menu, you can:
Go to the Decoder Settings
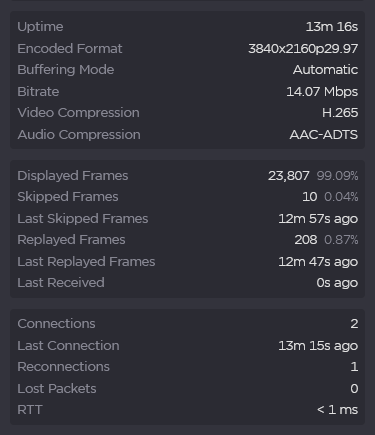
View the Detailed Statistics
Reset Statistics (for the individual decoder)
Reset All Statistics (for all decoders and all streams)
Hide Audio Channels from the stream preview (see Audio Level Meters in the Stream Monitoring section, below)
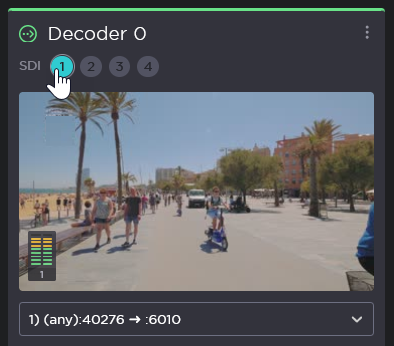
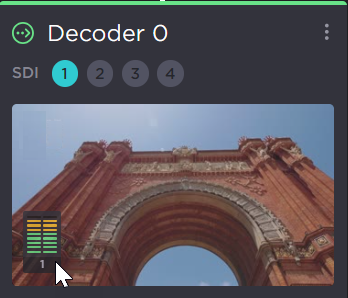
To change or add SDIs on select decoders, click SDI 1, 2, 3, or 4 under the decoder name. SDIs in use will appear in teal.
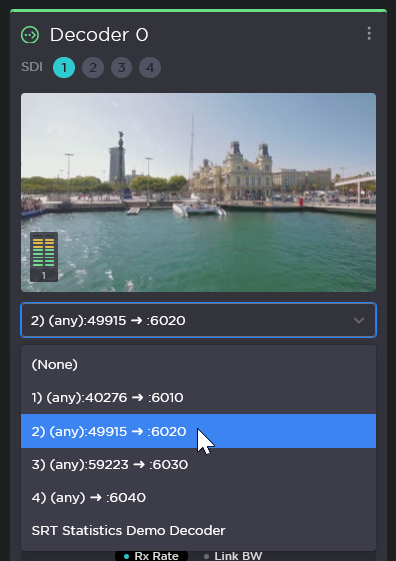
To change the stream assigned to the decoder, select a new stream from the streams dropdown.
To view the associated Stream, click the Stream icon . This will take you to the Streams page.
To start or stop the decoder, click the Start/Stop icon /.
Whenever necessary, Apply and Cancel buttons will appear at the top right of the dashboard. To apply any configuration changes made from the dashboard, click Apply.
Stream Monitoring
The Dashboard provides users with information to monitor their streams, including:
Preview thumbnails for each stream being decoded. As shown in the following example, these previews include Audio Level Meters to track the presence of audio in the associated stream.
There can be up to eight Audio Level Meters displayed per thumbnail, each identified by channel number.
You can choose to hide or show the audio levels (see Navigation and Configuration above), and level meters are hidden automatically when there is no audio in the stream.
Graphs tracking the Bandwidth for each stream. SRT streams also track the stream Delay, as shown in the following example.
Note
For non-SRT streams, this graph will track the Receive Rate (Rx Rate) only.
Graphs tacking the Skipped, Replayed, and Displayed frames.
A list of key statistics.
JavaScript errors detected
Please note, these errors can depend on your browser setup.
If this problem persists, please contact our support.