Dashboard Screen
To view an overview of your Gateway, including graphs of the network bandwidth and CPU and memory usage in the sidebar, click Dashboard.
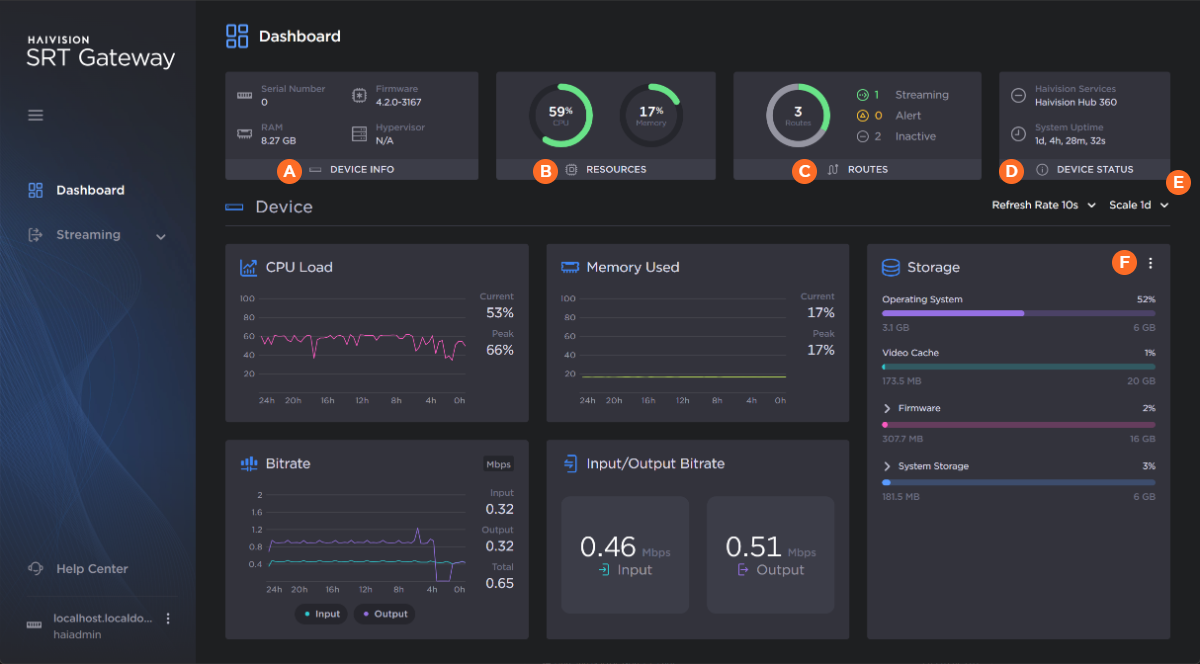
| Device Info | A summary of your Gateway. Clicking the |
| Resources | The current CPU load and memory usage. Clicking the |
| Routes | A summary of the number of routes used in your Gateway. Clicking the |
| Device Status | Lists the pairing status (to HMP for Media Gateway or to Hub 360 for SRT Gateway) and the system uptime. Clicking the |
| Graph Options Dropdowns | Use the dropdowns to specify the refresh rate and time scale for the graphs. The refresh rate indicates how often the graph is updated and the time scale indicates the amount of time displayed on the graph. When the actual timeframe exceeds the specified time scale, only the most recent data of the specified length of time is displayed. That is, if 5 Minutes is selected, only the last five minutes of data is displayed. Any data older than five minutes is dropped from the graph. |
| Storage Options | Clicking the |
Related Topics