Viewing a Route’s Statistics
A route's statistics gives you access to real-time data regarding the route's input and outputs. To view statistics for a route:
In the sidebar, click
 Streaming.
In the Routes tab, locate the desired route.
Click the
 icon
icon  of the route you are interested in.
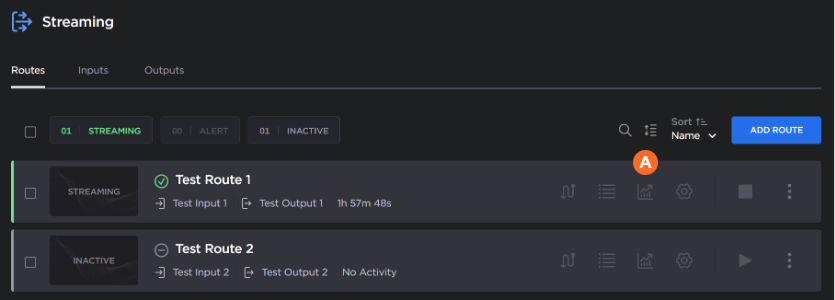
When the Statistics pane appears, you can view the pertinent data for the routes' input and outputs. See Stream Statistics Field Descriptions for detailed descriptions of each statistic.
The information for the input and
  output(s) appears in a column identified by the name and protocol in the heading.
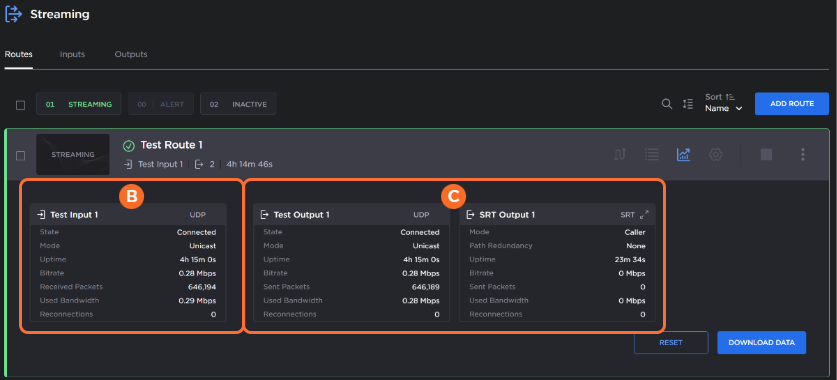
Tip
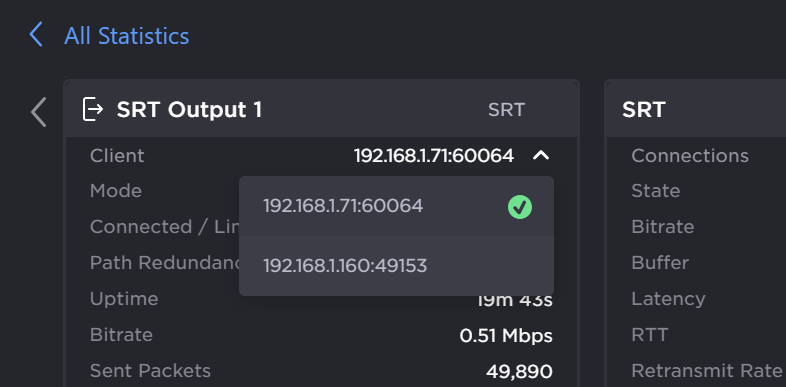
For SRT Listener streams, you can view the statistics for each connected client by selecting the Client in the dropdown menu, as shown in the following figure.
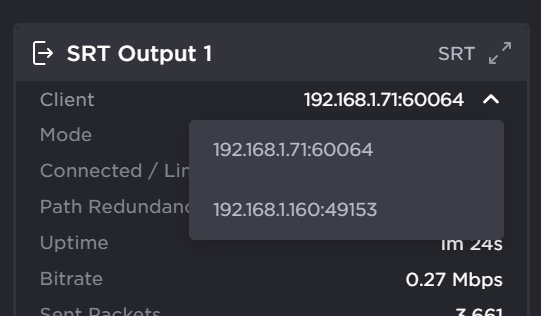
SRT Listener Client Stats
Other elements are available on the as shown in the following figure and list:
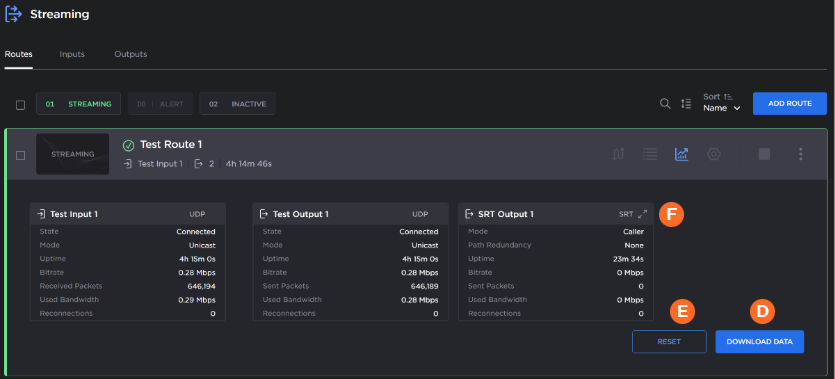
| To download a JSON file containing route statistics data from the past 24 hours, click the Download Data button. Tip After clicking the Download Data button, the download may take a few seconds to begin. |
| To reset the statistic counters to zero, click the Reset button. |
| To view the data graphically for SRT inputs or outputs, click the |
SRT Statistics Graphs
For SRT inputs/outputs, after clicking the icon for a route, the following pane appears:
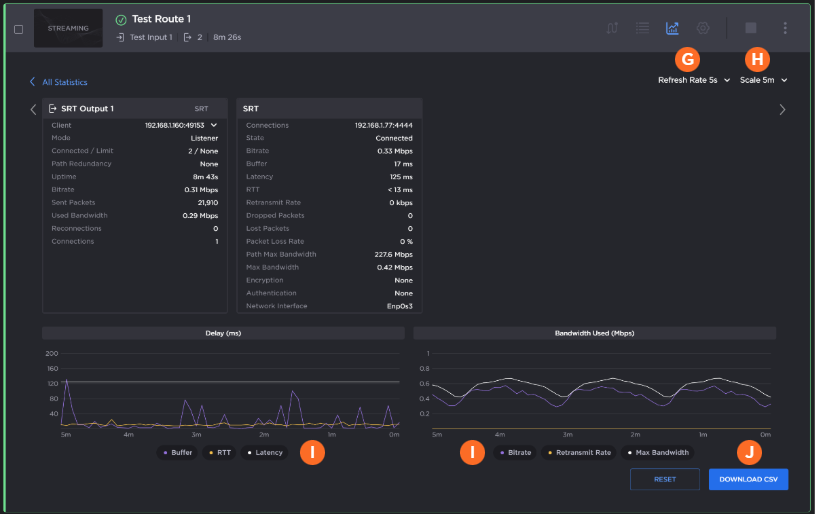
| Set the Refresh Rate with the drop-down menu in the title bar. |
| Change the scale interval using Timescale drop-down menu. This adjusts the x-axis in the graphs. Options include: 5 minutes, 1 hour, and 1 day. |
| Clicking an item in each legend hides/shows the corresponding data components in the graph. |
| To save the data for use with another application (such as a spreadsheet), click the Download CSV button. Tip
|
For SRT Listener streams, you can view the statistics graph for each connected client by selecting the Client in the dropdown menu, as shown in the following figure:
SRT Listener Client Graphs
Related Topics