Dashboard Screen
After signing in, StreamHub opens to the Dashboard screen. The Dashboard is where you perform a majority of your day-to-day tasks. These involve setting up inputs, encoders, and outputs for your various transmissions.The dashboard screen is split into three (3) sections:
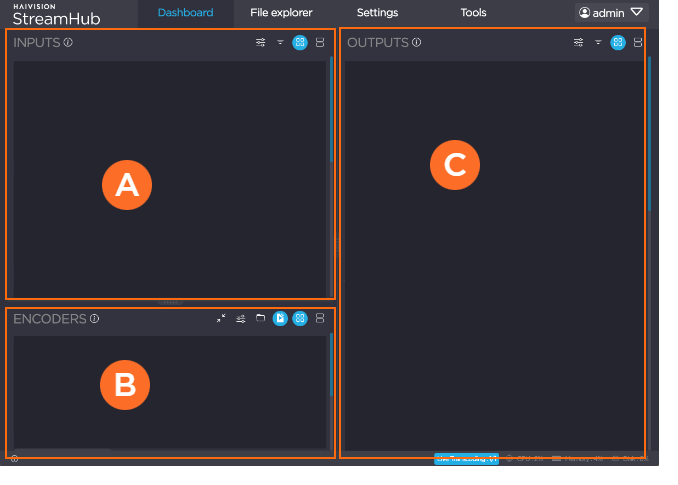
![]() Inputs section
Inputs section
![]() Encoders/File Explorer section
Encoders/File Explorer section
![]() Outputs section
Outputs section
Each section is comprised of:
Toolbar of icons representing the available actions with a blue version of the icon indicating a current selection.
Section
 resizing handles to manually adjust the container.
Thumbnails representing the available devices, sources, and outputs appropriate for that section. See Thumbnails for a quick overview of actions available from a thumbnail.
Inputs Section
The Inputs section ![]() is where you manage your:
is where you manage your:
Streams coming from field units (using SST protocol). Field units connected directly to StreamHub automatically appear in this section.
Streams coming from third-party IP sources (using RTSP, HLS, RTMP, TS, SRT, and NDI protocols).
Recorded files that may have been stored on the server.
Inputs toolbar includes:
 IP Input Profiles
 Filter – select between any combination of types (devices, IP Profiles, Multi-View) and states (Off, On, Live)
 Thumbnail view
 List view
Encoders/File Explorer Section
The Encoders/File Explorer section ![]() is where you can adapt encoding formats to IP destination profile requirements or explore files stored on StreamHub.
is where you can adapt encoding formats to IP destination profile requirements or explore files stored on StreamHub.
To view the File Explorer in this section, click the
 icon.
icon.To view the Encoders in this section, click the
 icon.
icon.
The Encoders/File Explorer toolbar includes:
- (Encoders only) Encoder Profiles – add, search, and edit profiles
- Switches to File Explorer (with search) view
- Switches to Encoder view
- Thumbnail view
- List view
Outputs Section
Outputs section ![]() is where you can manage various outputs:
is where you can manage various outputs:
SDI physical outputs.
NDI over IP.
IP destinations towards third-party devices (using RTSP, HLS, RTMP, TS, and SRT protocols)
Output toolbar includes:
- IP Output Profiles
- Filter – select between any combination of types (Hardware, NDI, IP Profiles) and states (Off, On, Live)
- Thumbnail view
- List view