From the Streams page, you can view statistics and parameters for individual streams in the Streams List.
To view Kraken stream statistics:
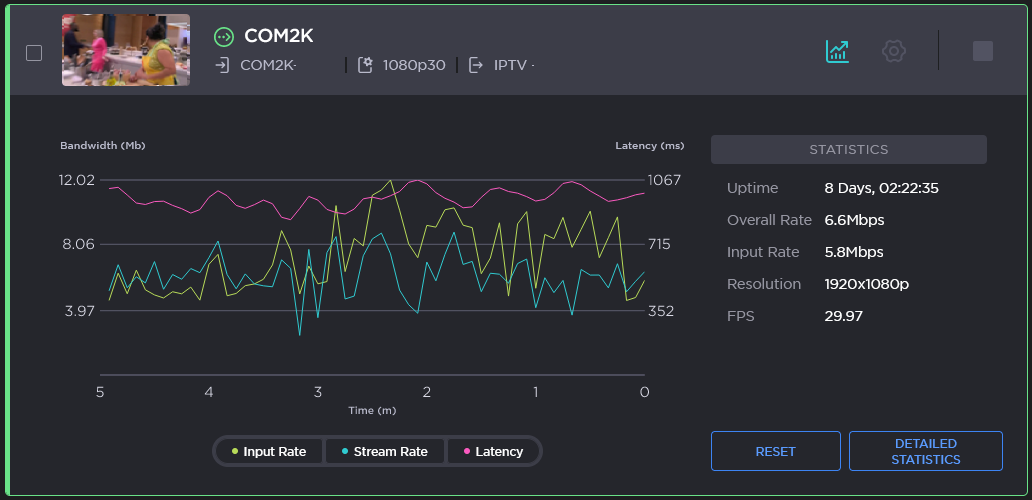
From the Streams List view, click the Statistics icon on the stream panel of any active stream. The overview statistics, as well as a graph tracking Input Rate, Stream Rate, and Latency, will expand under the stream panel. For details, see Stream Statistics.
The Statistics graph provides a visual representation of the Stream's Input Rate, Stream Rate, and Latency. You can edit this graph by clicking on the Input Rate, Stream Rate, or Latency buttons to (de)select these statistics.
Note
By exception, the Stream Rate statistic will not appear on Bypass streams, since these streams are not being transcoded.
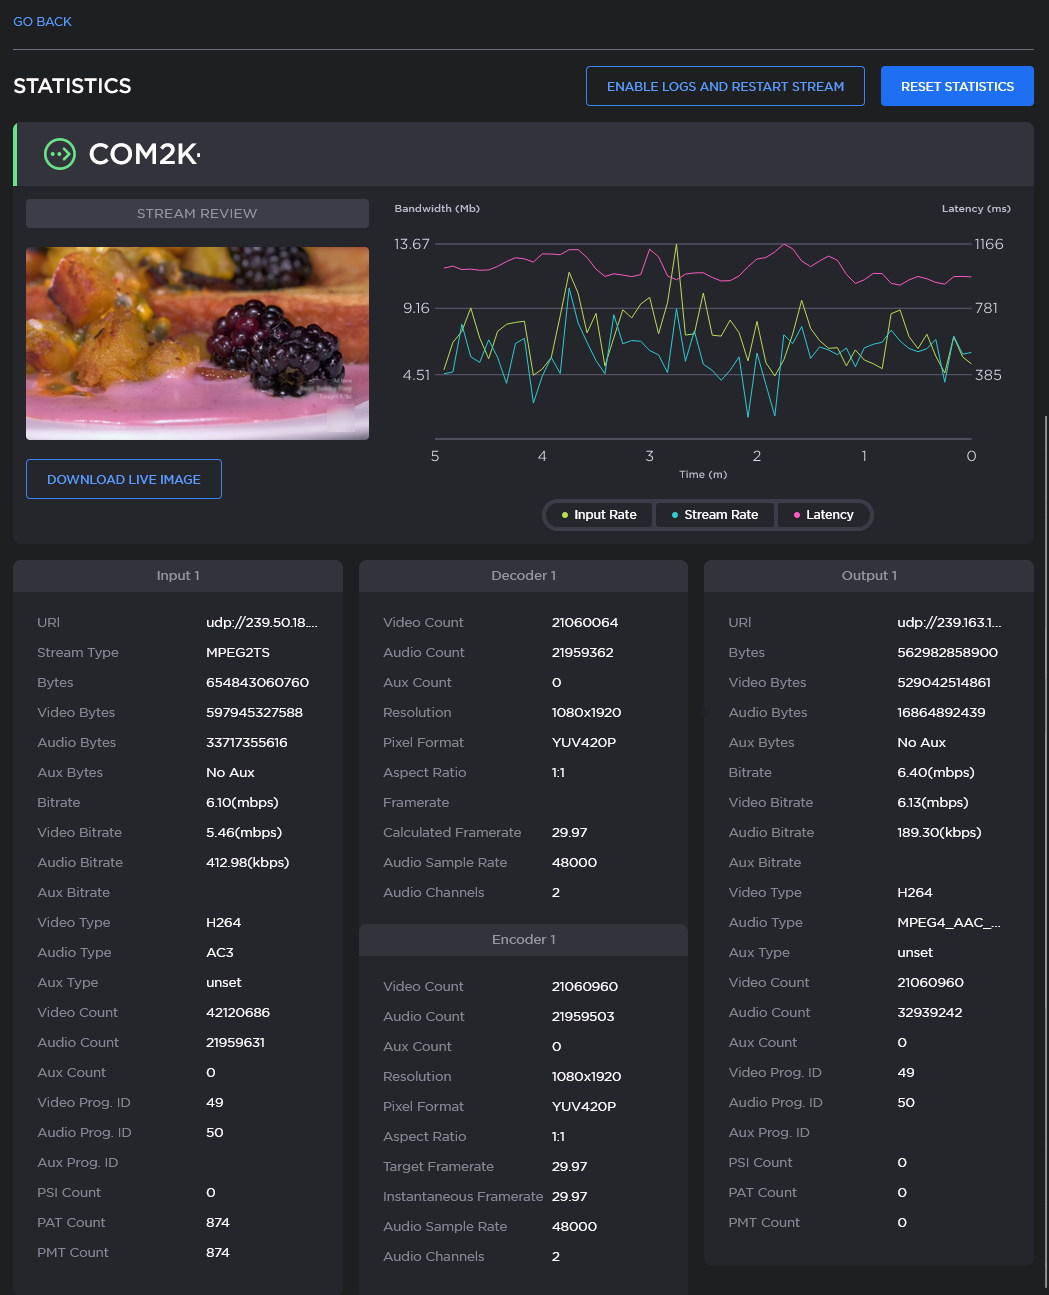
To view all available statistics, including Input, Output, Encoder and/or Transcoder statistsic, click the Detailed Statistics button. A separate statistics page will open, as in the following example:
From the Detailed Statistics page, you can:
Click the Download Image button to download a high resolution live image of the stream, visible from the Stream Review thumbnail.
Edit the statistics graph by clicking on the Input Rate, Stream Rate, or Latency buttons to (de)select these statistics.
Re-enable disabled logs and restart the stream by clicking the Enable Logs and Restart Stream button at the top of the page.
Note
This button only appears on transcoded streams which have had logs disabled.
d. Click Reset Statistics to reset all the current stream statistics.