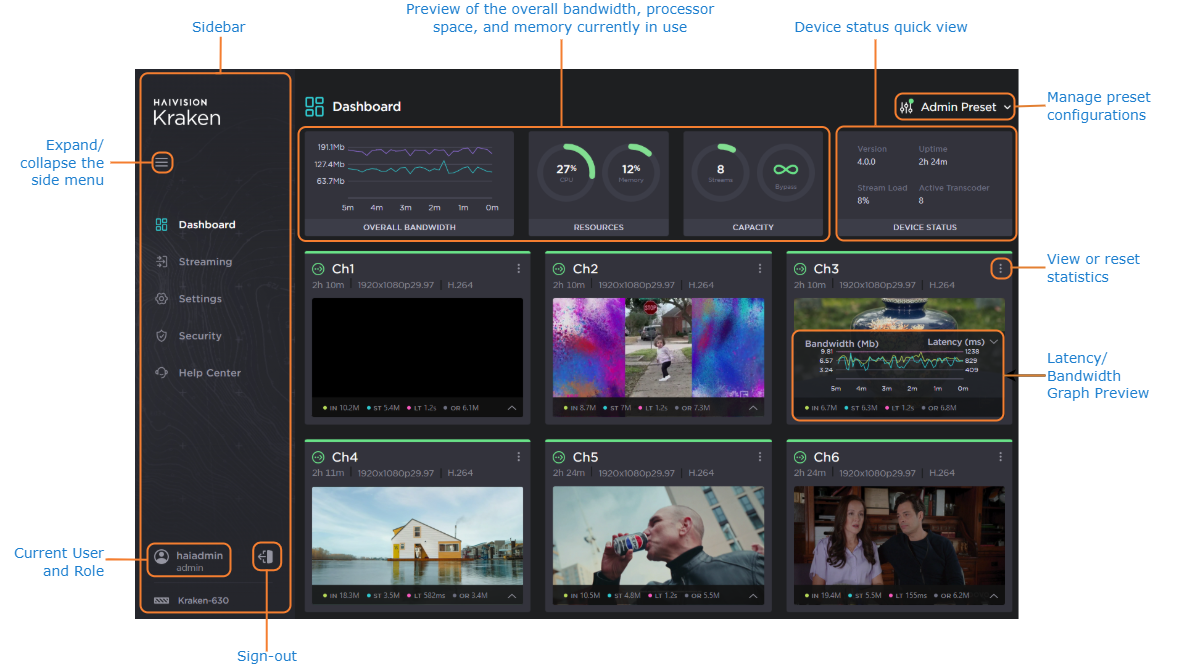
Once you have successfully signed in, the Kraken Web interface opens to the Dashboard.
Web Interface
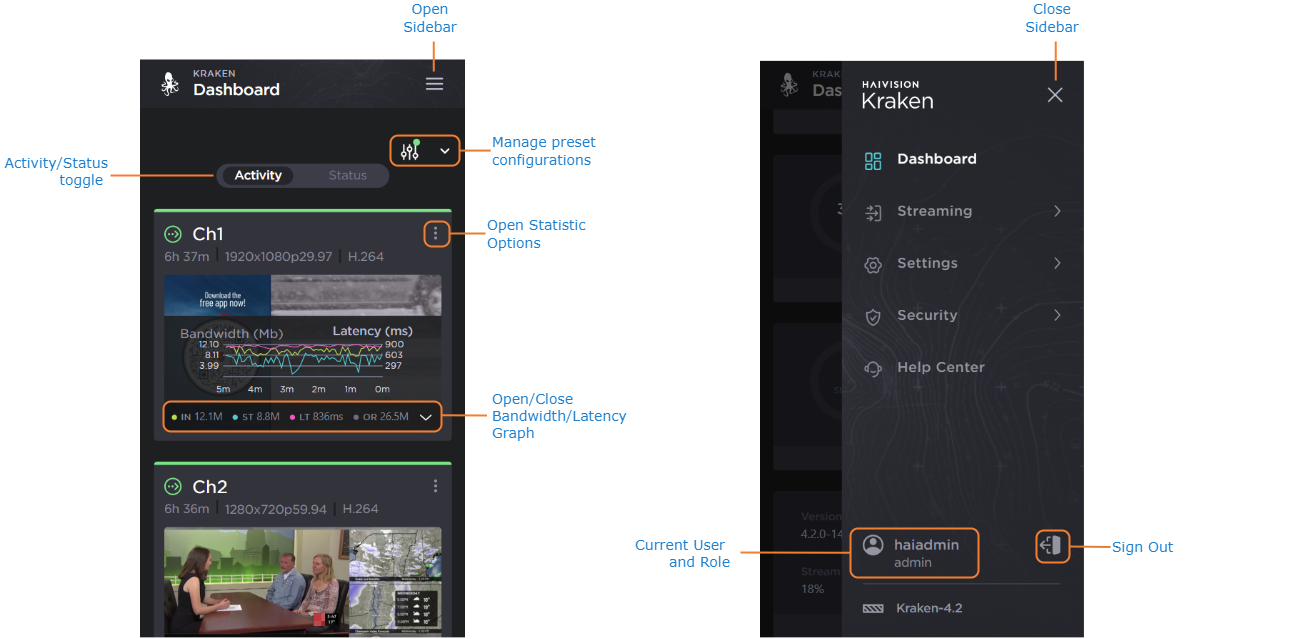
Mobile Interface
From the Dashboard, you can monitor your streams, and the overall Kraken system. See the sections below for details.
Stream Monitoring
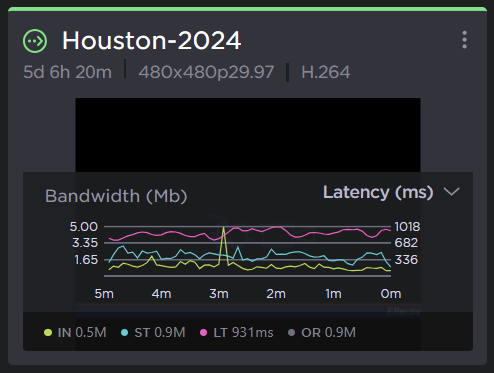
The Dashboard provides users with information to monitor up to 16 streams, including:
Video preview thumbnails,
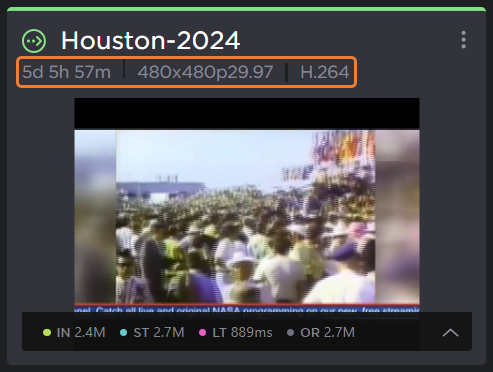
A header indicating the stream up-time, resolution, and video compression in use,
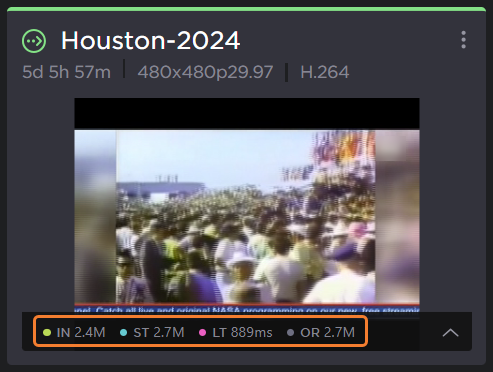
Preview statistics, including the input rate, stream rate, latency, and overall rate,
Graphs tracking the stream Bandwidth and Latency,
From the more options menu, users can view the Detailed Statistics, or Reset Statistics.
System Monitoring
The dashboard provides users with key system information, including:
Tip
To access system information from the Mobile Interface, toggle to the Status page.
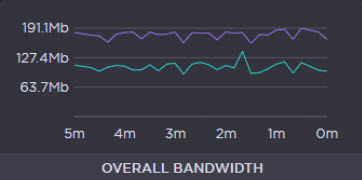
An Overall Bandwidth chart, displaying the overall bandwidth in Mb for Inputs (purple) and Outputs (teal).
Note
To access overall bandwidth information, the time on your browser and your server must be in sync, otherwise you will receive an error. To change the time on your server, see Network Settings > Network Time.
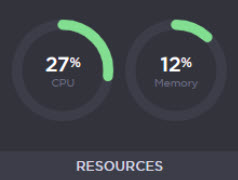
The percentage of CPU and Memory Resources being used.
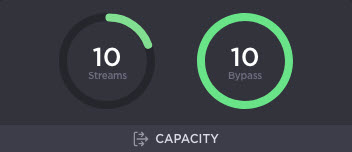
A Capacity Card, demonstrating the Stream and/or Bypass capacity load.
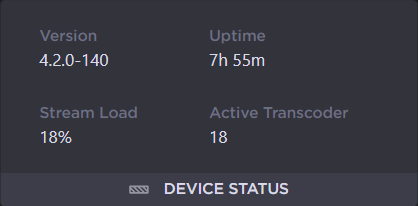
The Device Status Information, including: Version, Uptime, Stream Load, and Active Transcoder.