Viewing Destination Status
To view various statistics and telemetry of a destination, click the ![]() icon under the destination preview.
icon under the destination preview.
For StreamHubs, the following sections appear when expanding the destination:
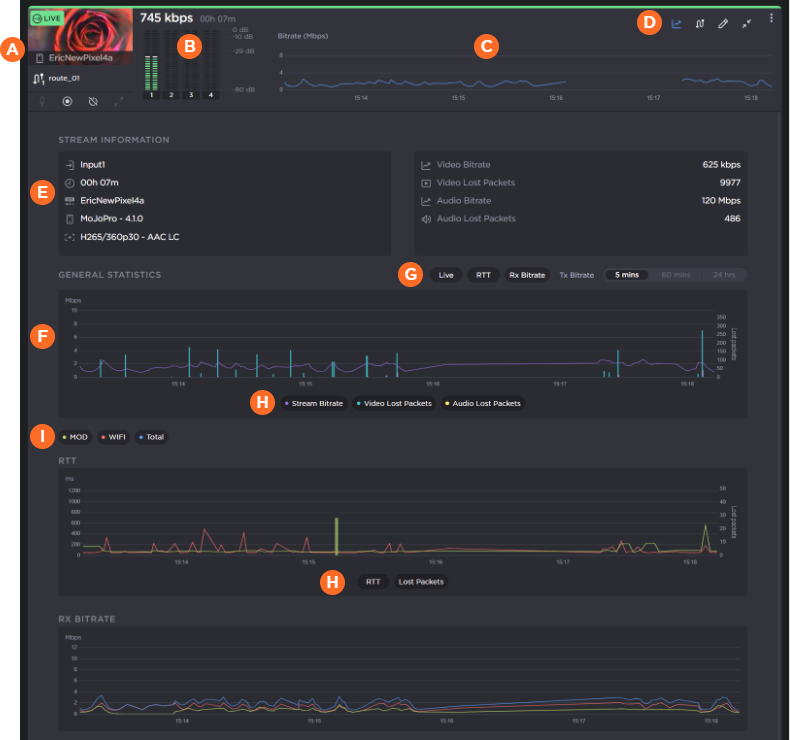
| Route Tile as described in Routes Pane. |
| Volume Meters |
| Bitrate Graph |
| Action Bar allows you to |
| Stream Information section shows the codec and protocol of the stream, as well as various statistics of your stream. |
| General statistics, RTT (round-trip time), and Bitrate graphs. |
Graph toggle buttons: | |
| Above the General graph:
|
| In the legend below each graph, click each item to toggle their display in the graph. |
| Above the RTT, Rx Bitrate, and TX Bitrate graphs, click the network connection buttons to toggle their display in each graph. |
For Makito decoders, the following sections appear when expanding the destination:
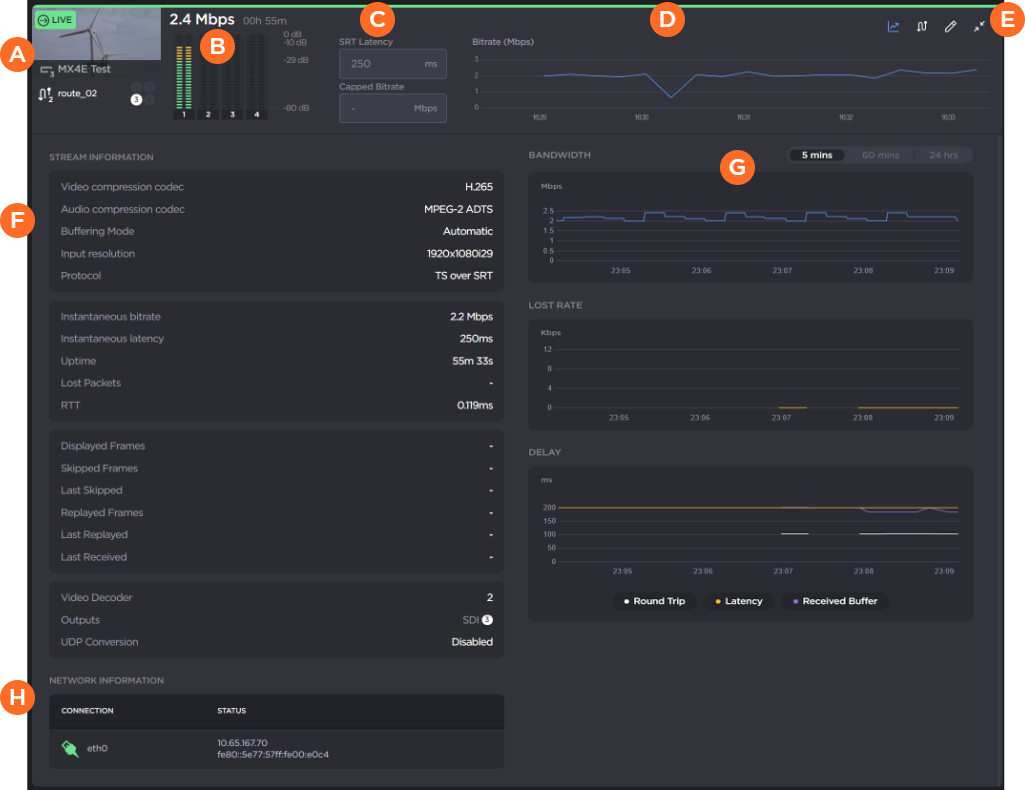
| Route Tile as described in Routes Pane. |
| Volume Meters |
| Latency/Capped Bitrate setting |
| Bitrate Graph |
| Action Bar allows you to |
| Stream Information section shows the codec and protocol of the stream, as well as various statistics of your stream. |
| Bandwidth, lost packet rate, and delay graphs.
|
| Network Information shows the network connection and IP address. |
For external destinations, limited information is available, since detailed stream protocol and statistics is not available to Hub 360:
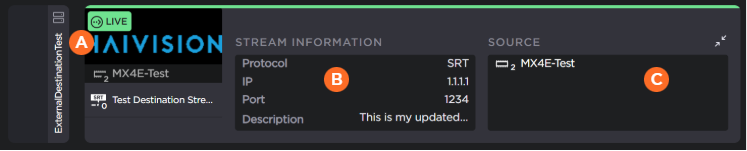
| Route Tile as described in Routes Pane. |
| Stream information section shows the protocol, IP address, port, and description. |
| Source section includes the source name.
|